The latest coronavirus infection data has shown that cases in Trafford are once again on the rise.
After briefly going down last week, the latest rates – for the week ending October 22nd – demonstrate that numbers appear to be increasing fast.
The infection rate in Trafford currently stands at 417.9 per 100,000 people, a rise of 29% week on week.
That’s actually the second lowest rate of any Greater Manchester boroughs, with only Stockport, at 371.8, below Trafford.
All boroughs have witnessed a sharp rise however, with Oldham and Wigan now over 600, and Oldham up 51% week on week.
The average for the whole of England is 214.1, according to the Public Health England data.
But what’s the picture across Trafford if you dig down into individual areas and villages, or Middle layer Super Output Areas, as Public Health England calls them.
Here’s are the latest figures for the week ending October 21st.
| Total cases (Oct 14-21) | Change from previous week | 7-day rolling rate (per 100,000 people) | |
| West Timperley | 32 | Up 5 (18.5%) | 367.2 |
| Broadheath & Firsway | 24 | Up 4 (20%) | 246.9 |
| Timperley North | 35 | Up 11 (45.8%) | 412.2 |
| Timperley East | 44 | Up 20 (83.3%) | 521.7 |
| Altrincham East | 30 | Up 12 (66.7%) | 293.9 |
| Altrincham West, Dunham & Warburton | 36 | Down 1 (2.7%) | 368.7 |
| Bowdon | 40 | Up 14 (53.8) | 497 |
| Hale | 29 | No change | 343.2 |
| Hale Barns | 37 | Down 6 (14%) | 442.8 |
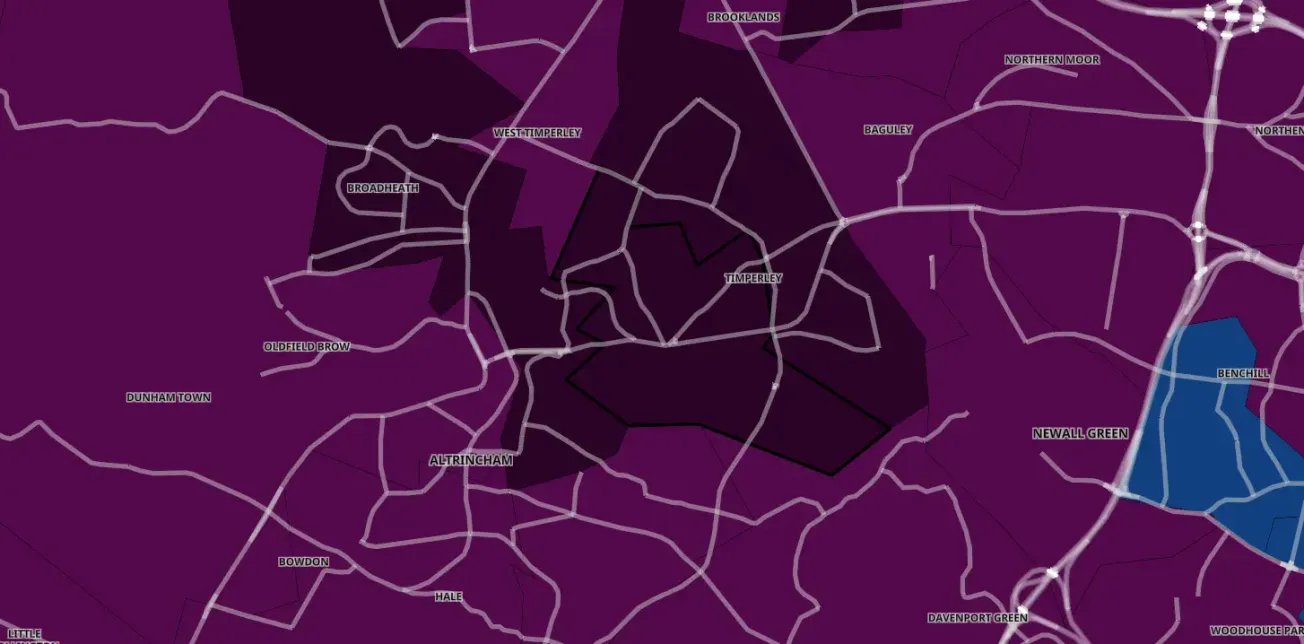
Coronavirus case data in Altrincham area for week ending October 21st 2020 Data: PHE
The data shows that Timperley North, Timperley East, Bowdon and Altrincham East have seen the sharpest rise in cases.
In other areas – Altrincham West, Dunham & Warburton, Hale and Hale Barns – the number of cases has actually decreased week on week, however.
The highest infection rate within Trafford is currently in Timperley East, where the rolling seven-day rate is 521.7.

